
Rising Channel Pattern! traders have been asking if this could be categorized as a chart pattern or just a tradable pattern. New to trading read through to find out more.
In this article, we will be discussing with you about rising channel/ pattern or whatever trader thinks it is, but be rest assured that you will be clarified on what it signifies and how-to.
Table of Contents
- What is a channel?
- What is a pattern ?
- Continuation chart pattern
- Reversal chart pattern
- Rising channel pattern
- Understanding rising channel pattern
- Identifying rising channel pattern
- Trading rising channel pattern using support and resistance
- Conclusion
What is a channel?
A rising channel pattern is basically a term used in finance and economics to describe a range of prices between buyers and sellers in which the value of an asset fluctuates.
A system of intermediates between the majority of products, supplies, and consumers for the purpose of movement of a good and services.
It can further be defined as a technical range or indifference between the support and resistance levels a commodity, stock, or currency pair has traded in for a predetermined period of time.
What is a pattern ?
The term pattern is basically a distinctive formation created by the upward and downward movement of commodity prices in a chart, patterns are usually identified by a line that intersects common price points such as closing price, Highs, or lows over a specified period of time.
Patterns can only occur at any point or measure in time. However, there are specifically two types of chart patterns Continuation chart pattern and Reversal chart pattern.
Continuation chart pattern
This chart pattern often occurs in a situation where the price of a commodity consolidates for a period of time, therefore, gathering enough momentum to continue its initial movement which could be an uptrend or downtrend. Continuation chart pattern may include falling wedge , Rising wedge.
Reversal chart pattern
Reversal chart pattern, this is a chart pattern which occurs when the price of a commodity or stock is highly oversold or at it’s peak, according to the law of supply and demand zone, the higher the price of a commodity the lower the buyers and the more sellers, While the lower the price of a commodity the lower the sellers and more buyers.
In this situation as the price of a commodity reaches its peak or makes a new/all-time high traders and investors tend to close their open position which there results in a market retracement or a change in direction.
In addition stock or commodity trading has three types of analysis conducted before a decision is made in the market, these include Fundamental Analysis, Technical Analysis, and Sentiment Analysis.
Fundamental analysis is vital when trading chart pattern as it makes a huge impact on commodities due to its significance. Reversal chart patterns may include Double Top and Bottom and Head and Shoulder patterns.
Rising channel pattern
A rising channel pattern in finance is considered a situation or a range of prices between buyers and sellers in which the value of the asset fluctuates basically in a distinctive formation created by the upward and downward movement of commodity prices in a chart.

Understanding rising channel pattern
A price channel typically appears on a commodity or stock chart when price becomes bounded between two parallel lines. In a scenario where the price is rising or ascending, commodity or stock traders who practice technical analysis uses it to gauge the momentum and specify the direction of the commodity.
Rising channels are quite useful in sporting and identifying potential support, resistance, breakout, and breakdowns. This occurs when a commodity price breaches either the upper or lower channel trend-line.
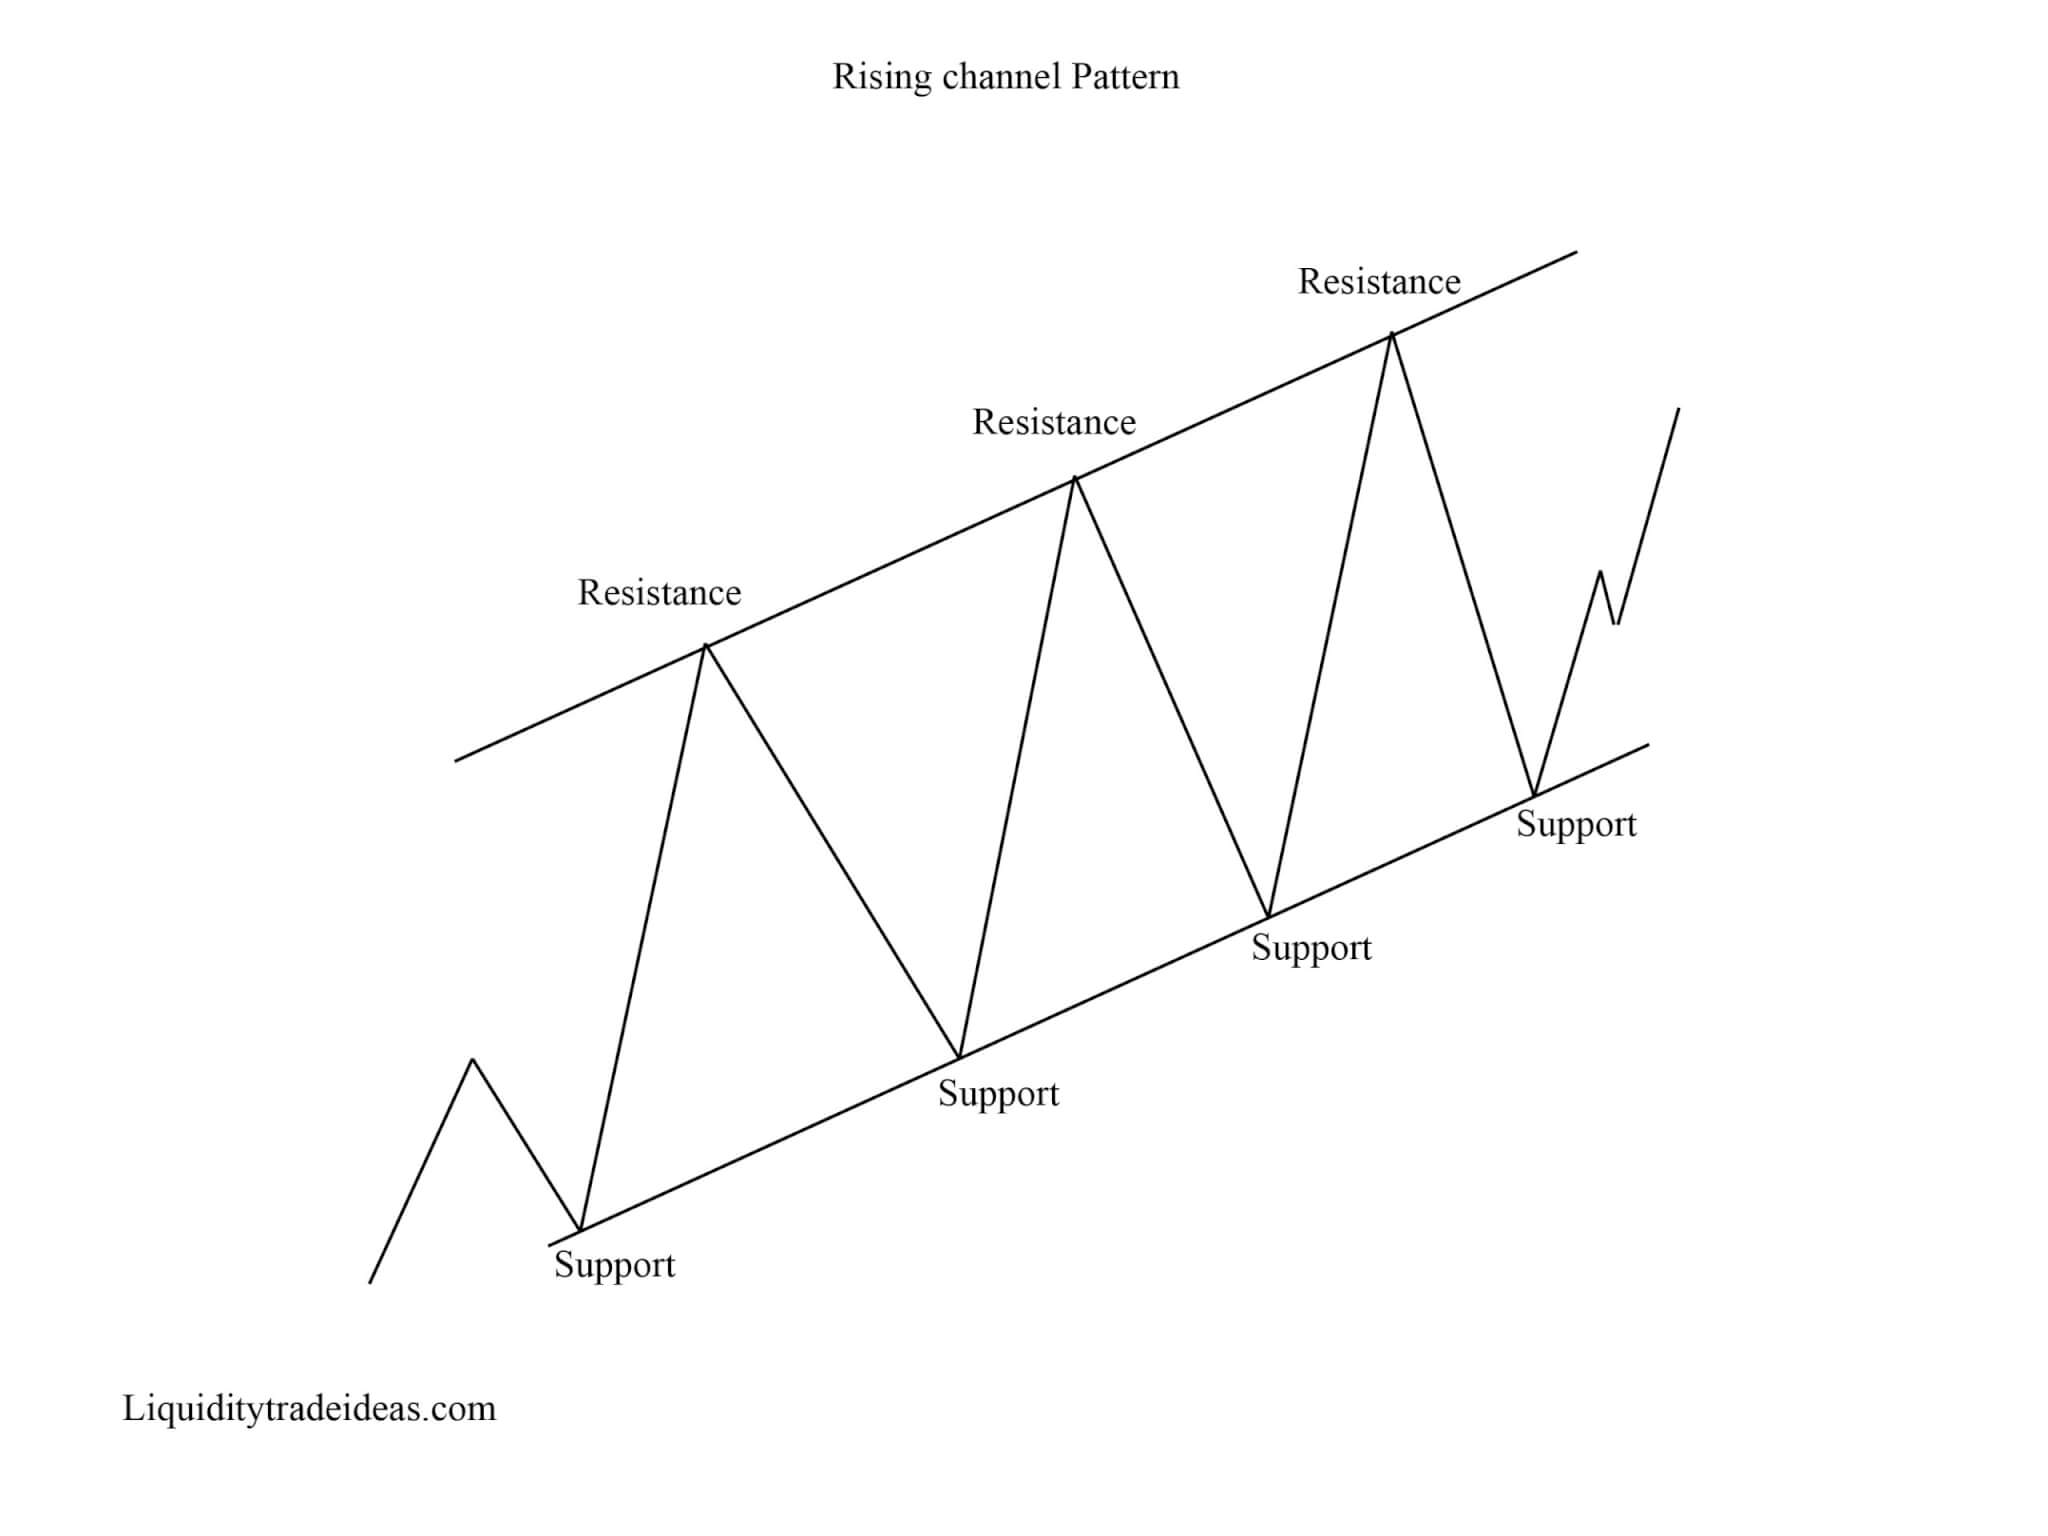
Identifying rising channel pattern
The rising channel pattern is basically the price action contained between upward sloping parallel lines, Higher highs and higher lows characterize this pattern. From the chart above technical analyst constructs a rising channel by drawing a lower trend line that mainly connects the swing lows and an upper channel line that connects strictly the swing high.
Trading rising channel pattern using support and resistance
Traders and investors tend to open a long position when the price of a commodity reaches the rising channel lower trend line or support area and exit or close their position when the price trades near the upper rising channel or resistance area.
However, traders and investors make good use of stop orders placed slightly below the lower trend-line to prevent losses if peradventure the commodity price reverses.
Conclusion
A rising channel pattern is majorly used in technical analysis to show an uptrend in a commodity price. The rising channel pattern is formed from two positive sloping trend lines drawn above (Higher highs) and below (Lower lows) the commodity.
Moreover, some trading indicators such as Simple Moving Averages (SMA) and Stochastic oscillators can be applied when trading the rising channel. It is also used commonly in technical analysis to confirm trends and identify breakouts and reversals.
what are your thoughts on this topic? is it useful? pls let us know on the comment session or forum for more related questions and suggestions, thank you.
“Chinedu is a forex/stock Trader, and content writer, With a passion for educating others about the financial markets. He works tirelessly through his writing to share insights and knowledge from years of experience trading in the financial market. He is dedicated to providing valuable information on what works and what doesn’t.