What is Azure Kubernetes Service (AKS) Network Observability? (Preview)
Kubernetes is a powerful tool for managing containerized applications. As containerized environments grow in complexity, it can be difficult to identify and troubleshoot networking issues in a Kubernetes cluster.
Network observability is an important part of maintaining a healthy and performant Kubernetes cluster. By collecting and analyzing data about network traffic, you can gain insights into how your cluster is operating and identify potential problems before they cause outages or performance degradation.
Overview of Network Observability add-on in AKS
Important
AKS Network Observability is currently in PREVIEW. See the Supplemental Terms of Use for Microsoft Azure Previews for legal terms that apply to Azure features that are in beta, preview, or otherwise not yet released into general availability.
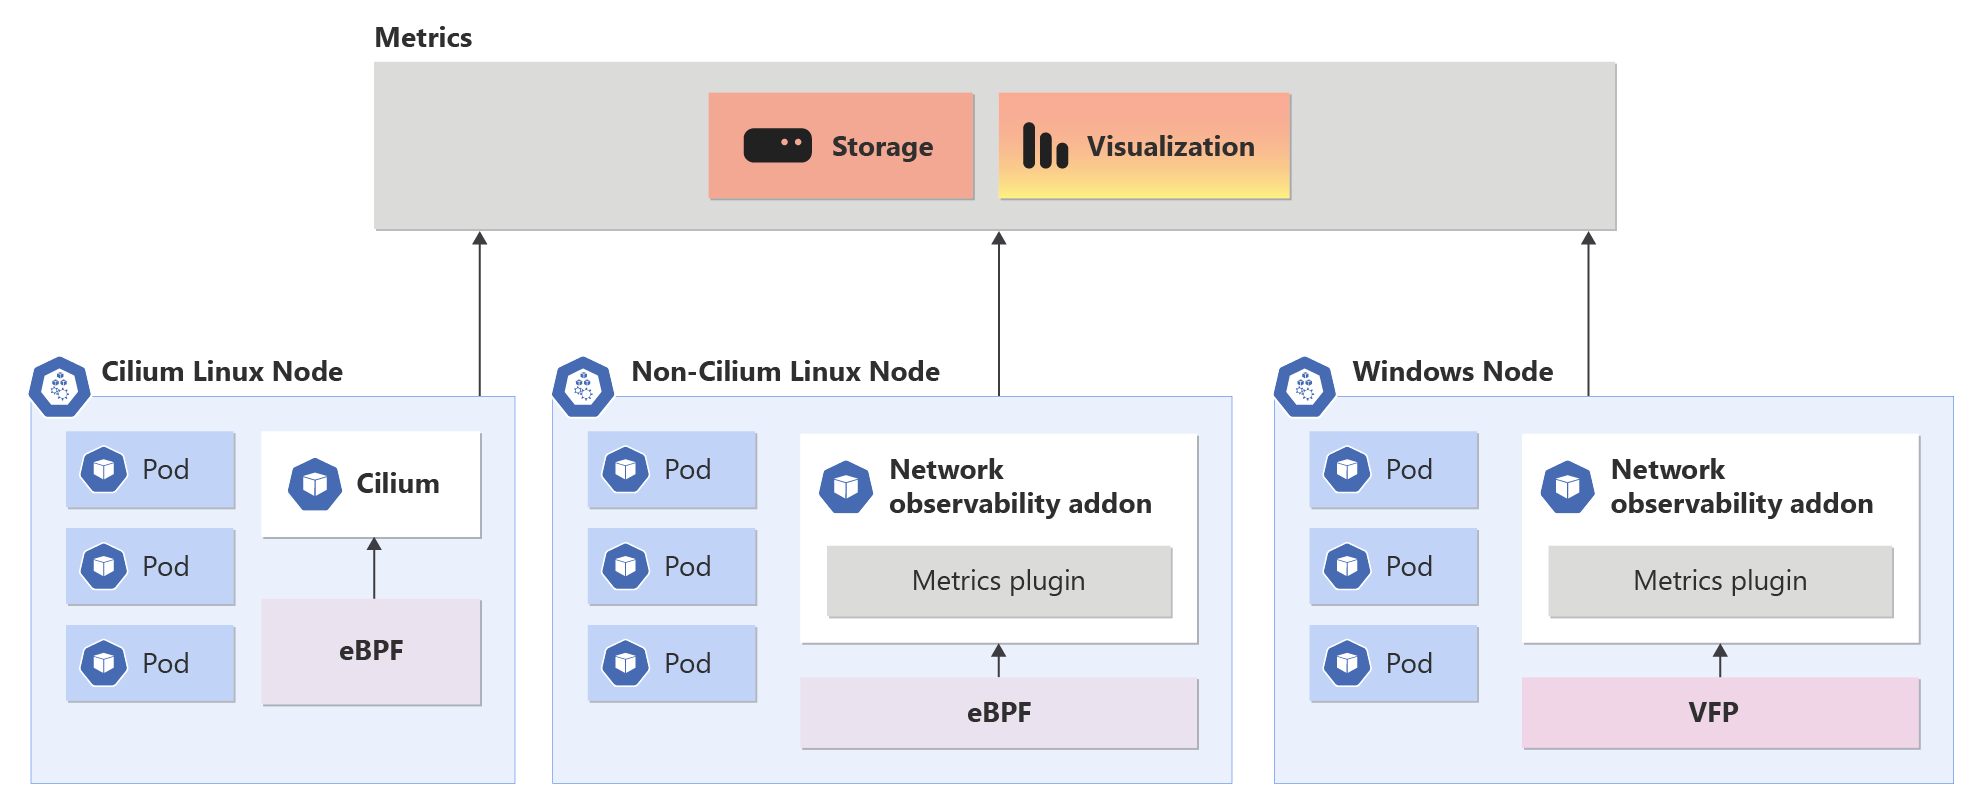
Networking Observability add-on operates seamlessly on Non-Cilium and Cilium data-planes. It empowers customers with enterprise-grade capabilities for DevOps and SecOps. This solution offers a centralized way to monitor network issues in your cluster for cluster network administrators, cluster security administrators, and DevOps engineers.
When the Network Observability add-on is enabled, it allows for the collection and conversion of useful metrics into Prometheus format, which can then be visualized in Grafana. There are two options available for using Prometheus and Grafana in this context: Azure managed Prometheus and Grafana or BYO Prometheus and Grafana.
Azure managed Prometheus and Grafana: This option involves using a managed service provided by Azure. The managed service takes care of the infrastructure and maintenance of Prometheus and Grafana, allowing you to focus on configuring and visualizing your metrics. This option is convenient if you prefer not to manage the underlying infrastructure.
BYO Prometheus and Grafana: Alternatively, you can choose to set up your own Prometheus and Grafana instances. In this case, you're responsible for provisioning and managing the infrastructure required to run Prometheus and Grafana. Install and configure Prometheus to scrape the metrics generated by the Network Observability add-on and store them. Similarly, Grafana needs to be set up to connect to Prometheus and visualize the collected data.
Multi CNI Support: Network Observability add-on supports both Azure CNI and Kubenet network plugins.
Metrics
Network Observability add-on currently only supports node level metrics in both Linux and Windows platforms. The below table outlines the different metrics generated by the Network Observability add-on.
| Metric Name | Description | Labels | Linux | Windows |
|---|---|---|---|---|
| networkobservability_forward_count | Total forwarded packet count | Direction, NodeName, Cluster | Yes | Yes |
| networkobservability_forward_bytes | Total forwarded byte count | Direction, NodeName, Cluster | Yes | Yes |
| networkobservability_drop_count | Total dropped packet count | Reason, Direction, NodeName, Cluster | Yes | Yes |
| networkobservability_drop_bytes | Total dropped byte count | Reason, Direction, NodeName, Cluster | Yes | Yes |
| networkobservability_tcp_state | TCP active socket count by TCP state. | State, NodeName, Cluster | Yes | Yes |
| networkobservability_tcp_connection_remote | TCP active socket count by remote address. | Address, Port, NodeName, Cluster | Yes | No |
| networkobservability_tcp_connection_stats | TCP connection statistics. (ex: Delayed ACKs, TCPKeepAlive, TCPSackFailures) | Statistic, NodeName, Cluster | Yes | Yes |
| networkobservability_tcp_flag_counters | TCP packets count by flag. | Flag, NodeName, Cluster | Yes | Yes |
| networkobservability_ip_connection_stats | IP connection statistics. | Statistic, NodeName, Cluster | Yes | No |
| networkobservability_udp_connection_stats | UDP connection statistics. | Statistic, NodeName, Cluster | Yes | No |
| networkobservability_udp_active_sockets | UDP active socket count | NodeName, Cluster | Yes | No |
| networkobservability_interface_stats | Interface statistics. | InterfaceName, Statistic, NodeName, Cluster | Yes | Yes |
Limitations
- Pod level metrics aren't supported.
Scale
Certain scale limitations apply when you use Azure managed Prometheus and Grafana. For more information, see Scrape Prometheus metrics at scale in Azure Monitor
Next steps
For more information about Azure Kubernetes Service (AKS), see What is Azure Kubernetes Service (AKS)?.
To create an AKS cluster with Network Observability and Azure managed Prometheus and Grafana, see Setup Network Observability for Azure Kubernetes Service (AKS) Azure managed Prometheus and Grafana.
To create an AKS cluster with Network Observability and BYO Prometheus and Grafana, see Setup Network Observability for Azure Kubernetes Service (AKS) BYO Prometheus and Grafana.
Feedback
Coming soon: Throughout 2024 we will be phasing out GitHub Issues as the feedback mechanism for content and replacing it with a new feedback system. For more information see: https://aka.ms/ContentUserFeedback.
Submit and view feedback for