Historical Debugging, Profiling, New Diagnostic Tools in Visual Studio 2015
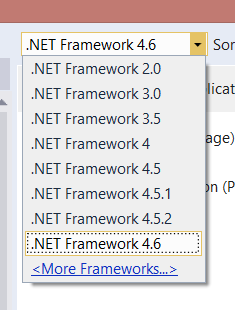 I've been working with Visual Studio 2015 lately, even for older projects. You can create and edit all kids of .NET app from .NET 2.0 all the way up through .NET 4.6, as well as ASP.NET 5 apps on the Core CLR.
In my case I've been doing some pair programming with Mark Downie on DasBlog, the blog system that runs this blog right here. DasBlog is very old, and used to be very actively developed. The question "is DasBlog dead" is asked a lot, but the answer is really "DasBlog is done." For years it has been very feature-full and feature-complete. However, this blog has been running on .NET 2.0 for years. Mark and I thought it would be nice to upgrade DasBlog to .NET 4.6, so we did. We've also moved DasBlog over to GitHub. You'll find it at http://github.com/shanselman/dasblog.
Now, to be clear, DasBlog was amazing in 2004 and 2008 but it's aging now. Mark and I think that's the fun of it, though. Mark's added Twitter Card and Facebook Open Graph support, and together we've fixed a few oddities and bugs that have popped up in the leap from 2.0 to 4.6. However DasBlog remains idiomatic .NET 2.0 which means it's C# 2.0, and doesn't even make good use of Linq or generics. We're thinking about a few updates, moving the Templating system to RazorEngine, updating to Linq queries, smarter threading for collections, better caching, as well of Mark's ideas around social.
You might think it's weird to use Visual Studio 2015 to work with a .NET 2.0 app, but it's useful to remember that you get to use new Visual Studio features even with older frameworks. One of the most useful new features is the Diagnostic Tools toolbox. It's a boring name for an amazing new part of VS. I'm not sure what they could call it other than Diagnostic Tools, but it's insanely convenient.
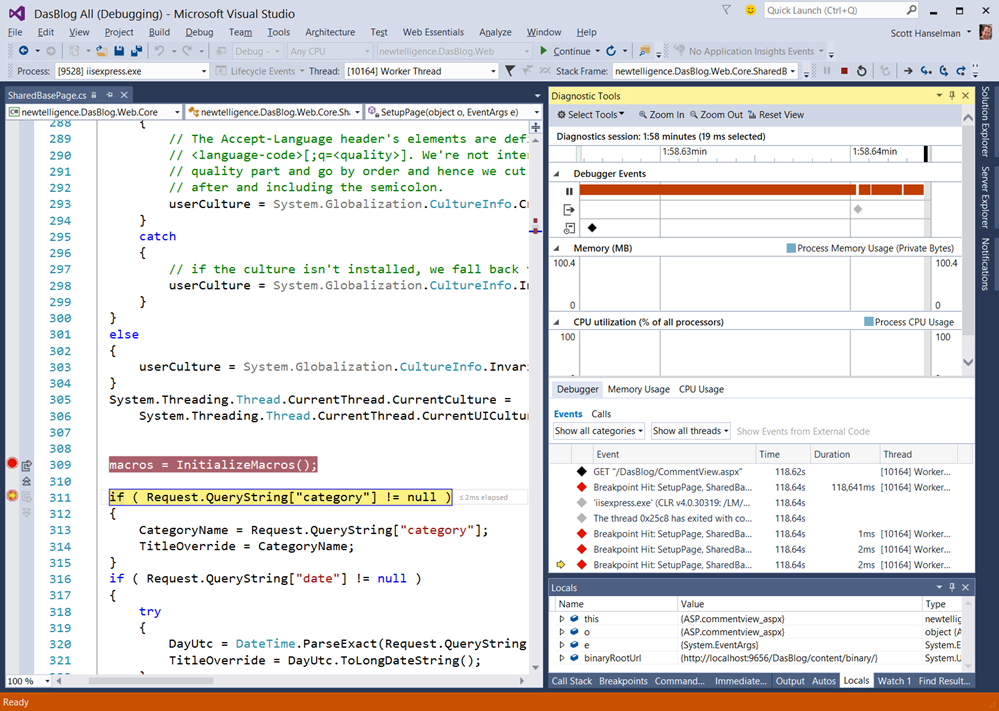
Often we think of Debugging and Profiling as two separate activities, and honestly, I talk to developers all the time that have never Profiled an app. They know that Profiling exists as a tool and a concept, but for whatever reason they forget about it, don't get around to it, or haven't adopted it as a fundamental part of their daily workflow.
The Diagnostic Tools in Visual Studio 2015 bring in data from a number of sources, Breakpoints, the Debugger, Tracing and Debug out, as well as Intellitrace Events and Historical Debugging (on supported SKUs).
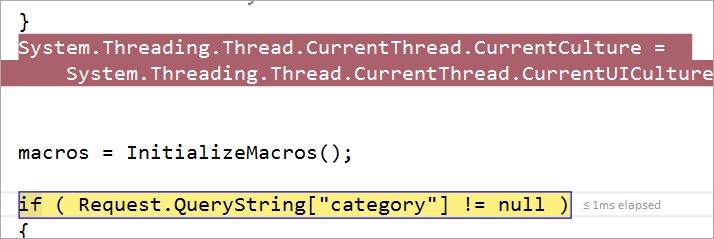
Notice in the screenshot above, I can even see a little tip showing how many milliseconds has elapsed between two breakpoints. It's little features like this that take data that has long been available but not in front of your face. Why dig for it?
I can even go back in time with Historical Debugging. See how I can backup and see the state of Local Variables and the Call Stack when I'm at a Breakpoint?
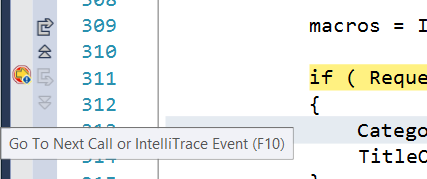
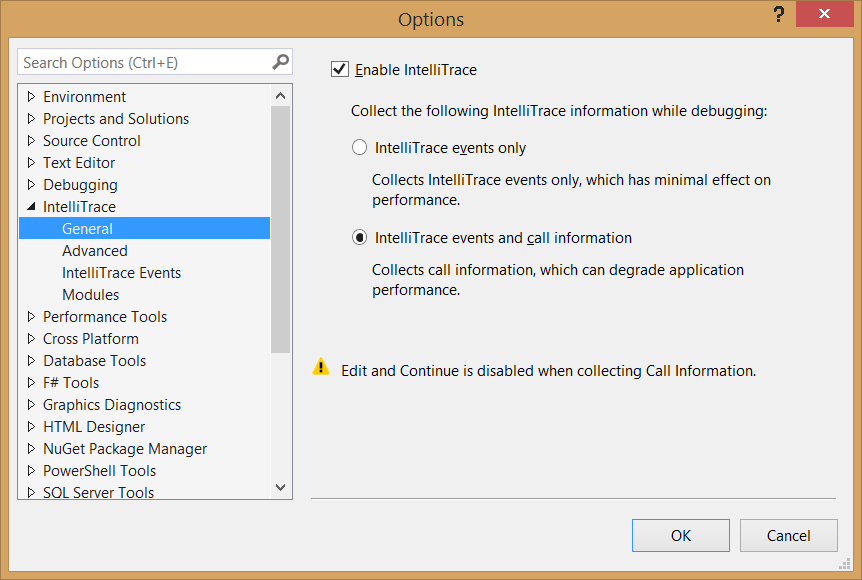
If you have a SKU with IntelliTrace, you can get extra info if you'd like to enable Historical Debugging.
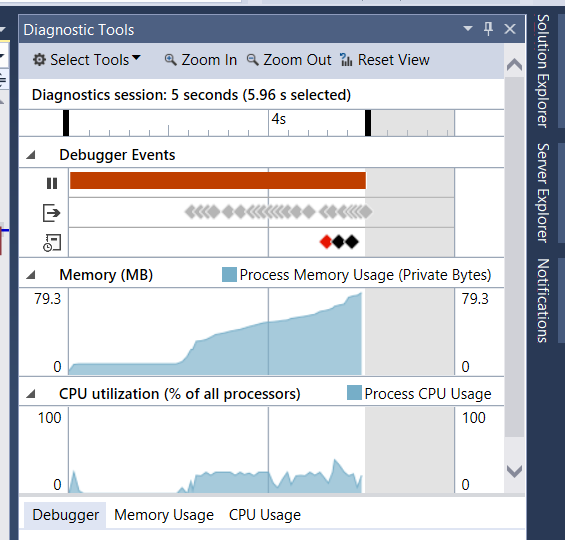
See how I've got Memory and CPU graphs, and I didn't have to do anything? This pops up automatically when Debugging:
I can take Memory Snapshots, go to the next Breakpoint, take another and compare!

If you've got Visual Studio 2015 and haven't started using these tools, I'd suggest you start exploring. They're useful enough that they've got me using VS2015 RC for all my projects, even older .NET 2.0 ones.
NOTE: Remember that Visual Studio Community is free for Open Source projects, and supports extensions! http://www.visualstudio.com/free
About Scott
Scott Hanselman is a former professor, former Chief Architect in finance, now speaker, consultant, father, diabetic, and Microsoft employee. He is a failed stand-up comic, a cornrower, and a book author.
About Newsletter
Being on a small team, we tend to only use the Pro version of Visual Studio. Whenever a new version comes out, everyone gets excited over some feature and it's usually... only in the enterprise version (ala CodeLens.. which is now in Pro).
The diagnostic tools window looks interesting, but I keep it disabled because its constant movement is a bit annoying and it doesn't really help with everyday debugging tasks. I have yet to find a problem this window solves for me...
When you say disabled the window, did you close it or did you disable it in Tools -> Options?
The window does not move when you are stopped at a breakpoint, did you find it distracting as your app was running, while you were stepping through code or something else?
Is there anything else we could put in the window that you think would help you with your everyday debugging tasks?
You might think it's weird to use Visual Studio 2015 to work with a .NET 2.0 app
Nope, not even remotely weird! Unless a newer version of Visual Studio actually broke support for an old version of .NET, I can't imagine why you wouldn't want to use the latest tools regardless of the project you were working on.
Thanks for mentioning (refocusing my attention on) some useful capabilities that will likely be very important and helpful in the very near future. Well, theoretically they actually would be important and helpful now, but technically this is till a RC.
Hopefully this is something that will change in the future. The BI tooling has traditionally been out-of-sync with the IDE and I assume I am not the only developer who has been prevented from upgrading do to this situation.
Matt
“The diagnostic tools failed unexpectedly. The Diagnostic Hub output in the Output window may contain additional information.”
The workaround on the VS forum is bizarre as well: http://blogs.msdn.com/b/visualstudioalm/archive/2015/05/06/known-issue-for-diagnostics-tool-window-in-visual-studio-2015-rc-the-diagnostic-tools-failed-unexpectedly.aspx
Doesn't seem quite ready yet.
Unfortunately with Chrome I get - "The diagnostic tools failed unexpectedly. The diagnostics Hub in the Output window may contain some additional information". (There were some performance counter errors in the output window?)
With IE 11 I get - "The Diagnostic Tools window does not support debugging using the 'Script' debug engine.
Is it just trying to tell me it won't work with web projects? I'm running an ASP.NET MVC 5.2.2 app (with both MVC and WebAPI controllers).
First impressions tho - seems very fast - is this due to the new compiler?
@Edward: for profiling the feature is available in Community and up. IntelliTrace is in Enterprise only
@Matt: if your diagnostics hub output says "A cluster resource failed", then you are hitting this issue. It was an unfortunate issue with certain OS/VS locale configurations that we missed during testing, hopefully you can get it to work and try it out!
@Will: check the link that Matt provided above, you are likely hitting this problem. Sometimes the error message can instead refer to 'Script' debug engine, it doesn't matter whether it is Chrome or IE, it is the same OS/VS locale issue that is causing the error.
Thanks for the post.
Just want to check something. Am I to understand that VS 2015 will be able to open old projects from VS 2008 for example. Because w/ VS 2013 I was not able to do that. To be more specific it is a WinForms for CF 3.5 kind of project. Right now I'm stuck w/ VS 2008.
Is this just a wrong take on my part?
Thanks in advance for your reply.
Comments are closed.

thanks for the article.
I'm really looking forward in using VS 2015 for my projects.
I've two questions left:
- Is the RC stable enough to use it really in productional environments?
- My license is currently VS2013 Premium with MSDN, may I use the enterprise VS2015 just from now or do I have to wait until rls date?