Cross-platform diagnostic tools for .NET Core
.NET Core is cross-platform and open-source. Tell someone, maybe your boss.
A good reminder. It's been this way for a half decade but I'm still bumping into folks who have never heard this. Moving forward, .NET 5 will be a unification of the .NET Framework you may have heard for years, and the new .NET Core I like talking about, PLUS great goodness, tools and libraries from Mono and Xamarin. It's one cross-platform .NET with a number greater than 4. Because 5 > 4, natch.
NOTE: If you like, you can learn all about What is .NET? over on my YouTube.
Now you've made some software, maybe for Windows, maybe Mac, maybe Linux. There's a lot of ways to diagnose your apps in .NET Core, from the Docs:
- Logging and tracing are related techniques. They refer to instrumenting code to create log files. The files record the details of what a program does. These details can be used to diagnose the most complex problems. When combined with time stamps, these techniques are also valuable in performance investigations.
- Unit testing is a key component of continuous integration and deployment of high-quality software. Unit tests are designed to give you an early warning when you break something.
- Debug Linux dumps explains how to collect and analyze dumps on Linux.
But I want to talk about the...
.NET Core Diagnostic Global Tools
First, let's start with...
dotnet-counters
dotnet tool install --global dotnet-counters
Now that I've installed it, I can see what .NET Core apps I'm running, like a local version of my Hanselminutes podcast site.
dotnet counters ps
     18996 hanselminutes.core D:\github\hanselminutes-core\hanselminutes.core\bin\Debug\netcoreapp3.1\hanselminutes.core.exe
     14376 PowerLauncher C:\Program Files\PowerToys\modules\launcher\PowerLauncher.exe
     24276 pwsh       C:\Program Files\PowerShell\7\pwsh.exe
I also see PowerShell 7 in there that I'm running in Windows Terminal. Pwsh is also written in cross platform .NET Core.
I'll run it again with a process id, in this case that of my podcast site:
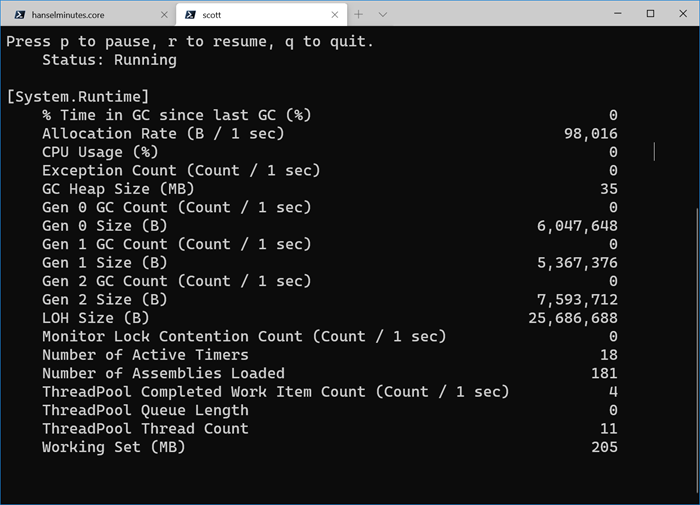
dotnet counters monitor --process-id 18996
Here I'll get a nice constantly refreshing taskman/processmonitor of sorts in the form of dotnet-countersperformance counters:

Again this works outside Visual Studio and it works everywhere. You can watch them and react, or collect them to a file.
dotnet-dump
The dotnet-dump tool is a way to collect and analyze Windows and Linux core dumps without a native debugger. Although it's not yet supported on macOS, it works on Windows and Linux.
With a similar syntax, I'll dump the process:
dotnet dump collect -p 18996
Writing full to D:\github\hanselminutes-core\hanselminutes.core\dump_20200918_224648.dmp
Complete
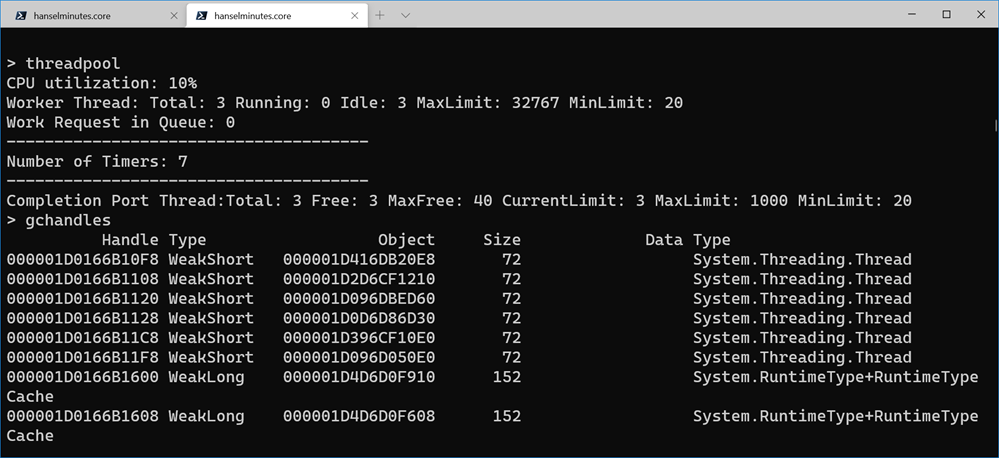
Then I'll start an interactive analysis shell session. You can run SOS (Son of Strike) commands to analyze crashes and the garbage collector (GC), but it isn't a native debugger so things like displaying native stack frames aren't supported.
dotnet dump analyze .\dump_20200918_224648.dmp
Loading core dump: .\dump_20200918_224648.dmp ...
Ready to process analysis commands. Type 'help' to list available commands or 'help [command]' to get detailed help on a command.
Type 'quit' or 'exit' to exit the session.
>
There's tons to explore. Debugging production dumps like this is a lost art.

You can also do live Garbage Collector dumps with
dotnet-gcdump
GCDump is:
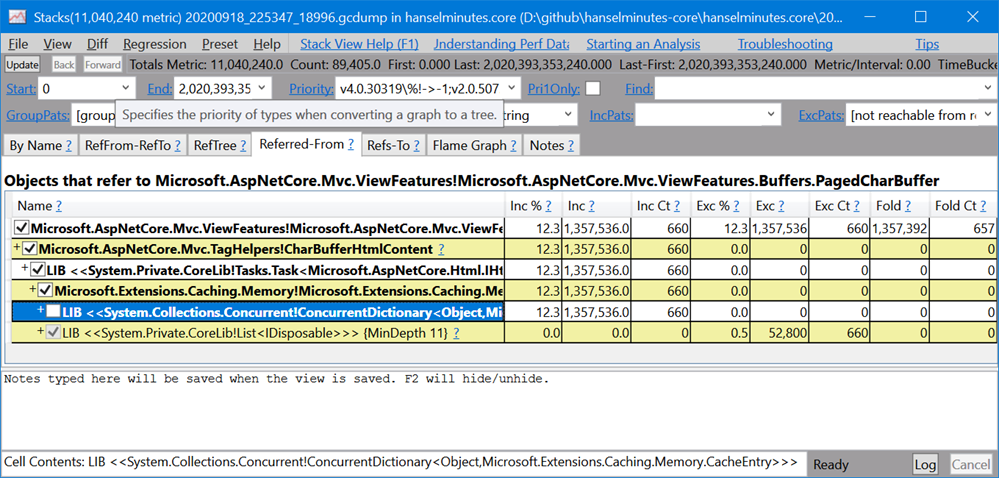
"a way to collect GC (Garbage Collector) dumps of live .NET processes. It uses the EventPipe technology, which is a cross-platform alternative to ETW on Windows. GC dumps are created by triggering a GC in the target process, turning on special events, and regenerating the graph of object roots from the event stream. This process allows for GC dumps to be collected while the process is running and with minimal overhead."
Once you have a dump you can analyze it in Visual Studio or PerfView on GitHub.

Sometimes you may capture a dump from one machine and analyze it on another. For that you may want to download the right symbols to debug your core dumps or minidumps. For that you'll use
dotnet-symbol
This is great for Linux debugging with lldb.
"Running
dotnet-symbolagainst a dump file will, by default, download all the modules, symbols, and DAC/DBI files needed to debug the dump including the managed assemblies. Because SOS can now download symbols when needed, most Linux core dumps can be analyzed using lldb with only the host (dotnet) and debugging modules."
Interesting in some real tutorials on how to use these tools? Why not learn:
- How to debug a memory leak in .NET Core
- Debug high CPU usage
- Debug deadlock shows you how to use the dotnet-dump tool to investigate threads and locks.
In the next blog post I'll look at dotnet trace and flame graphs!
Sponsor: Have you tried developing in Rider yet? This fast and feature-rich cross-platform IDE improves your code for .NET, ASP.NET, .NET Core, Xamarin, and Unity applications on Windows, Mac, and Linux.
About Scott
Scott Hanselman is a former professor, former Chief Architect in finance, now speaker, consultant, father, diabetic, and Microsoft employee. He is a failed stand-up comic, a cornrower, and a book author.
About Newsletter
.NET Core is cross platform (sic) and open source (sic). Tell someone, maybe your boss. A good reminder. It's been this way for a half decade but I'm still bumping into folks who have never heard this.So, you're asking us to do some pro bono advertisement for Microsoft? That entails putting our own reputations on the line. It becomes mortally dangerous when Microsoft has put the following on Channel 9:
For .NET Framework, you can only have one version of the framework installed on the same machine, which is used by all applications. ... This behavior might result in regressions. For developers, it usually means that the Framework upgrade was a company-wide decision performed by the IT department, which sometimes, delays the upgrades.I watch this video on a machine that had several versions of .NET Framework installed side-by-side. And I'd rather my boss stayed away from that video, least he believes those technically erroneous assertions and give me a chashiering for not keeping him in the loop for "a company-wide decision" that "might result in regressions"!
At least, do us a favor and spell "open-source" and "cross-platform" correctly. ("Open-source" is an adjective, while "open source" is a noun group with rare uses. "Cross platform" is just wrong.)
.NET Core is in fact, cross platform, and runs anywhere, and you can have many versions of .NET Core installed AND if you like, an app can even have it's own private version.
Thanks in advance and regards,
If you want to consume the counters from an external process (like dotnet-counters), you'll want to use the Microsoft.Diagnostics.NETCore.Client package to communicate with the diagnostics server. I'd recommend looking at the dotnet-counters source for how to do so.
NET Core is cross-plat form and open-source. Tell someone, maybe your boss.
A good reminder. It's been this way for a half decade but I'm still bumping into folks who have never heard this.
Apart from a subset of developers and IT reps, no one pays attention to new version releases. Business want the technology to work, be low cost, not have forced upgrades every two and a half years, be easy to deploy and easy to manage.
Case in point, what is the business critical new feature which is going to be in .net 5? The list of improvements, once you exclude purely technical things such improved performance, unified code base, better cross-platoform, web assembly handling and such has little left to make a business case for upgrading to .net 5.
Cost of upgrading multiple systems to .net 5 versus actual business improvements.
One of the great things about .net core and .net 5 is that you can bundle the framework with the tool that uses it. That is really freeing in our company for LOB apps as we are no longer dependent on getting .net updated on user's machines which can be a pain. The tools take up more hdd space, but that's not a big problem for us.
usual information a person supply on your guests? Is gonna be again continuously in order to investigate cross-check new
posts
Comments are closed.
